
CAGR Explained: The Honest Way to Measure Investment Growth


“My investment is up 150%” sounds impressive — until you ask over how long? Two years and twenty years are completely different stories, and that is why professionals rarely quote total returns on their own. They use the compound annual growth rate (CAGR): the single, steady yearly rate that would have turned your starting value into your ending value. It is the fairest way to compare investments that ran for different lengths of time — as long as you know the three situations where it quietly misleads.
The CAGR formula
CAGR = (End value ÷ Start value)1 ÷ years − 1
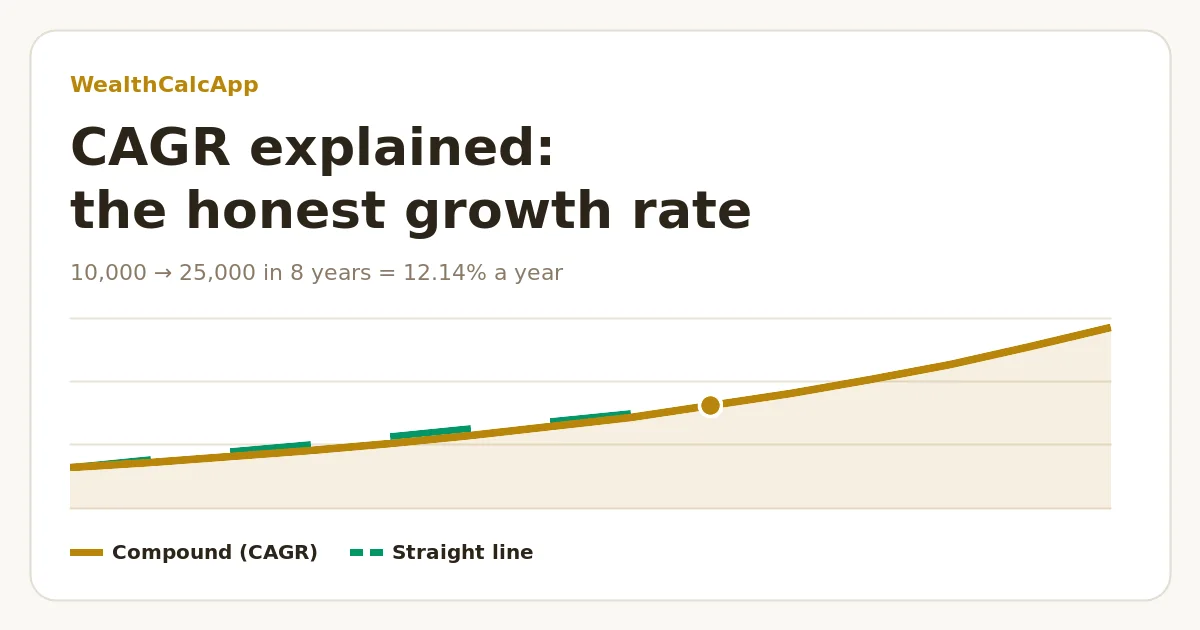
Take an investment that grew from $10,000 to $25,000 in 8 years. The ratio is 2.5; its 8th root is 1.1214; subtract 1 and you get a CAGR of 12.14% a year. Check it: $10,000 × 1.12148 ≈ $25,000. Note what CAGR is not: it isn’t the total return (150%), and it isn’t that 150% divided by 8 (18.75% “a year”), which overstates growth because it ignores compounding.
In a spreadsheet, =(End/Start)^(1/Years)-1 works everywhere, and Excel also has a dedicated RRI(years, start, end) function. Or use our free CAGR calculator, which also projects the value forward and tells you how long the money takes to double.
Why CAGR beats the average return
Averages of yearly returns flatter volatile investments. Suppose an investment earns +20%, −10%, +15%, −5% and +25% over five years. The arithmetic average is 9.0% a year, but $10,000 actually ends at $14,749 — a CAGR of only 8.08%. The gap is volatility drag: a loss hurts more than an equal gain helps, because it is applied to a larger base.
The extreme case makes the point unforgettable: +50% one year and −50% the next averages 0%, yet $10,000 becomes $7,500. The CAGR is −13.4% a year. CAGR tells you what you actually experienced; the average return tells you a story.
CAGR, ROI, annualised return and IRR
| Metric | What it answers | Use it when |
|---|---|---|
| ROI / total return | How much did it grow in total? | The period is fixed and obvious |
| CAGR | What steady yearly rate explains start → end? | One lump sum, comparing different periods |
| Average annual return | What was the typical single year? | Describing volatility, not wealth |
| IRR / money-weighted return | What yearly rate explains all my deposits and withdrawals? | You invested over time (DCA, savings plans) |
Trap 1: CAGR ignores money added over time
CAGR assumes a single deposit at the start. If you invest every month, it gives the wrong answer. Real example with Bitcoin daily closing prices: buying $500 of BTC every month from 22 October 2021 to 22 October 2026 meant 61 purchases, $30,500 invested and a portfolio worth $59,623 at the end (+95.5%). Plug those totals into the CAGR formula over five years and you get 14.4% a year — but that treats all $30,500 as if it had been invested on day one. The money-weighted return (IRR), which respects when each dollar went in, is about 27.5% a year. For savings plans use IRR — XIRR() in Excel or Google Sheets — or our Bitcoin DCA calculator, which works from real daily prices.
Trap 2: the start date changes everything
Same asset, same end date, three very different CAGRs — again using Bitcoin’s real closing prices up to 22 October 2026 ($84,012):
| Start date | BTC price then | CAGR to Oct 2026 |
|---|---|---|
| 22 Oct 2016 | $657 | 62.4% a year (10 years) |
| 10 Nov 2021 — the cycle peak | $64,995 | 5.3% a year |
| 21 Nov 2022 — after the FTX crash | $15,787 | 53.2% a year |
Anyone can make an investment look brilliant or terrible by choosing the window. When you read a CAGR, check the start and end dates, and prefer figures over several overlapping periods (rolling returns) to a single cherry-picked one.
Trap 3: nominal, fees and risk
- Inflation. A 7% nominal CAGR with 2.5% inflation is a real CAGR of (1.07 ÷ 1.025) − 1 ≈ 4.4%. Our inflation calculator shows what that difference does over decades.
- Costs and taxes. Compute CAGR on what you actually keep, after fees and taxes; a 1% annual fee comes straight off the rate.
- Risk. Two investments with the same CAGR can feel completely different. Look at the worst drawdown too: a 12% CAGR that included a −70% year is not the same experience as a steady 12%.
A shortcut: CAGR and the Rule of 72
Divide 72 by the CAGR to estimate how many years it takes to double your money: at 12.14%, about 5.9 years (the exact answer is 6.05). It works for costs too — at 3% inflation, prices double in roughly 24 years. Our Rule of 72 guide explains why the shortcut works and where it drifts.
Run the numbers
Use the CAGR calculator to annualise any start and end value, the ROI calculator to include fees and taxes, and the compound interest calculator to see what a given CAGR does to your savings over time.
Frequently asked questions
Calculate your CAGR
Enter a starting value, an ending value and the number of years to get your CAGR, total return and doubling time.
Open the CAGR Calculator →
Passionate about finance and investing, with more than 6 years of hands-on experience in the crypto world. He shares analysis and financial education on his YouTube channel, Cripto Adicto.
Watch on YouTube →