How to Calculate ROI: The Simple Formula and What It Leaves Out


ROI is the first number anyone quotes about an investment and the one most often quoted wrong. “I made 50% on that” can describe a brilliant three-year trade or a mediocre decade, before or after fees, before or after tax. The formula takes ten seconds. The real work is deciding what goes into it. This guide gives you the formula, then the four things that change the answer — costs, tax, time and money added along the way — with worked examples for shares, a rental flat and crypto. Every figure uses the same maths as our ROI calculator, so you can check each one yourself.
What ROI measures (and what it doesn’t)
Return on investment compares what you got back with what you put in. It is a ratio expressed as a percentage: an ROI of 25% means that for every $100 you committed, you ended up $25 better off. Because it is a ratio, it puts a $2,000 crypto punt and a $200,000 property on the same scale.
That is also its weakness. Plain ROI says nothing about how long the money was tied up, how much risk you took to earn it, or whether the figure is before or after the costs that came out of your pocket. It helps to keep three versions apart:
- Total ROI — the whole gain over the whole holding period. Fine for describing one investment, misleading for comparing two.
- Annualised ROI — the same gain expressed as an equivalent yearly rate, so a two-year and a ten-year investment can be compared fairly.
- Net ROI — after fees and tax. The only version that matches the money that actually lands in your account.
The ROI formula, step by step
The formula is short. What matters is filling each bracket honestly:
[TOTAL COST] = [PURCHASE PRICE] + [BUYING FEES] + [ANY MONEY ADDED LATER]
[FINAL VALUE] = [SALE PRICE OR CURRENT VALUE] − [SELLING FEES]
Start with the simplest case. You invest $10,000 and three years later it is worth $15,000. The gain is $5,000, and $5,000 ÷ $10,000 = 0.5, so the ROI is 50%. Had it fallen to $8,000 instead, the ROI would be −$2,000 ÷ $10,000 = −20%.
Two details matter more than they look. First, income counts: dividends, interest, rent or staking rewards belong in the formula even if you spent them. Leave them out and you understate the return on a dividend share or a rental. Second, the denominator is everything you committed, not just the sticker price. Commissions, stamp duty, renovation and later top-ups are all money you put in; leave them out and the result looks better than it was.
A useful sanity check is the break-even point: the final value that exactly equals your total cost. Anything below it is a loss, however good the headline price change looks.
From headline ROI to the money you keep
Same example, now with the costs a real investor pays: a 1% fee on the $10,000 invested and tax on the gain. In the US, long-term capital gains are taxed at 15% for most people — 0% or 20% at the extremes, and at ordinary income rates if you held for a year or less.
| Headline | After fees and tax | |
|---|---|---|
| Money committed | $10,000 | $10,100 |
| Final value | $15,000 | $15,000 |
| Tax on the gain (15%) | — | $735 |
| Profit | $5,000 | $4,165 |
| Total ROI | 50.0% | 41.2% |
| Annualised over 3 years | 14.5% | 12.2% |
Fees and tax took almost nine percentage points off the total and more than two points a year off the annualised figure. And a one-off 1% fee is the gentle case. Ongoing charges — a fund’s yearly fee, an adviser’s 1% a year — come out of a growing balance every year, so they compound against you. Our guide to how investment fees eat your returns shows how a 1% annual charge can cost a third of the final pot over a working life.
You can open this exact example in the ROI calculator and change the fee and tax rate to match your broker and your country.
Why time matters: annualised ROI
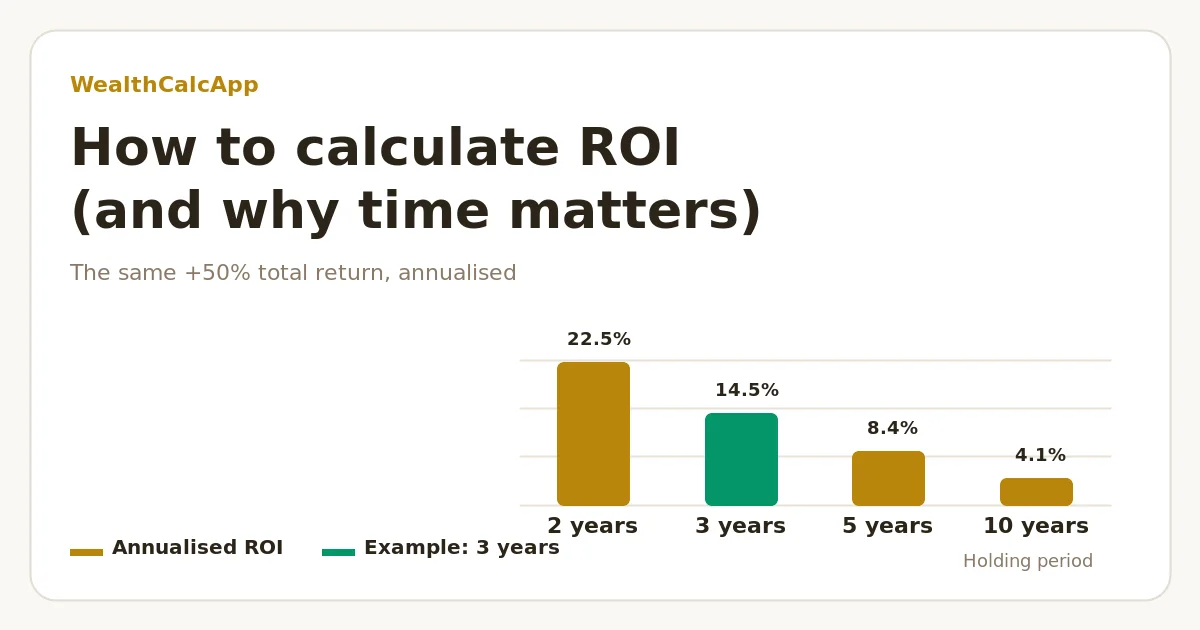
A 50% return is excellent over two years and poor over ten. To compare investments held for different periods, convert total ROI into an annual rate:
Example: (15,000 ÷ 10,000) ^ (1 ÷ 3) − 1 = 0.1447 → 14.5% a year
| A total ROI of 50% over… | Annualised ROI |
|---|---|
| 2 years | 22.5% |
| 3 years | 14.5% |
| 5 years | 8.4% |
| 10 years | 4.1% |
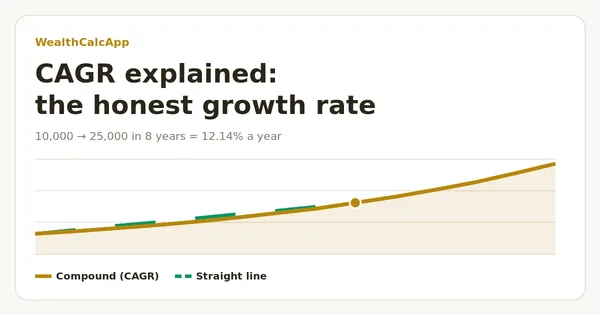
Dividing instead — 50% ÷ 3 = 16.7% — is the most common mistake. It ignores compounding and overstates the yearly return. The correct formula is the one behind CAGR; our article on CAGR explained covers when it flatters an investment and when it is fair. For a quick mental check, the Rule of 72 works backwards: money that doubles (a 100% ROI) in eight years has earned about 72 ÷ 8 = 9% a year.
Be wary of annualising very short periods. A 5% gain in one month annualises to almost 80% a year, which tells you nothing about what the next eleven months will bring.
Worked examples: shares, a rental flat and crypto
1. Shares with dividends. You buy 50 shares at $80 ($4,000) and pay a $10 commission. Over three years you receive $360 in dividends, then sell at $95 and pay another $10.
Money back = (4,750 − 10) + 360 in dividends = 5,100
ROI = (5,100 − 4,010) ÷ 4,010 = 27.2% → 8.3% a year over 3 years
Without the dividends the ROI would be 18.2%. The income supplied a third of the profit, which is why share-price charts alone understate what dividend investors earn.
2. A rental flat bought in cash. Price $200,000, plus $8,000 of closing costs and $12,000 of renovation: $220,000 in total. Net rent after maintenance, insurance and empty months comes to $9,000 a year. After five years you sell for $240,000 and pay 5% in agent and selling costs, leaving $228,000.
Money back = 228,000 + (5 × 9,000 rent) = 273,000
ROI = (273,000 − 220,000) ÷ 220,000 = 24.1% → about 4.4% a year over 5 years
A 20% rise in the price became about 4.4% a year once buying costs, renovation and selling costs were counted — and that is before income tax on the rent. (The simple annualisation treats the rent as if it all arrived at the end, so it slightly understates the true rate.) With a mortgage, the ROI on your own cash would be higher, but so would the risk: leverage magnifies losses exactly as it magnifies gains.
3. Crypto over 18 months. You buy 0.1 BTC at $60,000 ($6,000) and pay 1.5% in exchange fees and spread ($90). Eighteen months later you sell at $90,000 — $9,000, less 1.5% ($135).
Money back = 9,000 − 135 = 8,865
ROI = (8,865 − 6,090) ÷ 6,090 = 45.6% → 28.4% a year over 1.5 years
The price rose 50%; the ROI was 45.6%. Fees took four and a half points, and in most countries tax would take a good deal more. The prices are illustrative, not a forecast — a one-third fall over the same period would have cost you more than a third of the stake once fees were included.
Regular contributions: where simple ROI breaks
Most people don’t invest one lump sum. They add money every month, and that breaks the simple formula, because each payment has been invested for a different length of time.
Suppose you invest $300 a month for five years — $18,000 in total — and end up with $22,000. Simple ROI says 22.2%. Annualising that over five years gives about 4.1%, but that is wrong too: the first payment was invested for five years, the last for one month, so on average your money was only at work for about two and a half years. The rate that accounts for the timing — the money-weighted return, or internal rate of return (IRR) — is about 8.0% a year, nearly double.
You don’t need to solve it by hand. In Excel, Google Sheets or LibreOffice, list every payment as a negative number with its date and the current value as a positive number with today’s date, then use XIRR:
A62 = [CURRENT VALUE OF THE PORTFOLIO] B62 = [TODAY’S DATE]
=XIRR(A2:A62, B2:B62) → your annual money-weighted return
Withdrawals go in as positive numbers on the dates you took them. This is the honest way to judge a monthly savings plan or a dollar-cost averaging strategy, and it is what you should compare with a fund’s annual return.
Comparing investments with ROI: a five-point checklist
- Same basis. Compare net with net and annualised with annualised. A fund’s published return is usually after its own charges but before your platform fee and your tax.
- Same period. A fund that returned 60% over five years and one that returned 40% over three can’t be ranked on those numbers. Annualise them, and ideally compare the same calendar years.
- Against a benchmark. The real question is not “was my ROI positive?” but “did I beat what a cheap global index fund would have earned with similar risk?” If not, the extra effort cost you money.
- After inflation. Real ROI = (1 + nominal ROI) ÷ (1 + inflation) − 1, using inflation over the whole period. With 3% inflation a year, the 41.2% net ROI from our example is worth 29.2% in today’s money. Our guide to understanding inflation explains why that gap matters over decades.
- Adjusted for risk. 12% a year from a single small company and 8% from a diversified fund are not the same achievement. Ask how much the investment could have lost along the way, not just what it made.
What ROI can’t tell you
- It ignores risk. Two investments with the same ROI can have completely different odds of losing money. ROI measures the outcome, not the quality of the decision.
- Total ROI ignores time. Always ask “over how long?” — or annualise.
- It is easy to massage. Leaving out fees, tax, renovation or your own time all make an ROI look better. When someone quotes you an ROI, ask what is in the denominator.
- Simple ROI ignores the timing of cash flows. With regular contributions, withdrawals or income received along the way, use IRR (XIRR) instead.
- Past ROI doesn’t predict future ROI. Least of all after a short, spectacular run. A 300% year in crypto says more about that year than about the next one.
- Our calculator keeps it simple. It handles one amount in and one value out, a one-off percentage fee and a flat tax rate. It doesn’t model income received along the way, ongoing annual fees or tax allowances, so treat its answer as an estimate, not as tax advice.
References
- Wikipedia — Return on investment
- Wikipedia — Internal rate of return
- Investor.gov (US Securities and Exchange Commission) — Understanding fees
Frequently asked questions
Passionate about finance and investing, with more than 6 years of hands-on experience in the crypto world. He shares analysis and financial education on his YouTube channel, Cripto Adicto.
Watch on YouTube →Keep reading


Calculate your real ROI
Enter what you invested, what it is worth now, how long you held it, your fees and your tax rate to see total, annualised and after-tax ROI.
Open the ROI Calculator →