
Rent vs Buy in 2026: How to Decide With Real Numbers


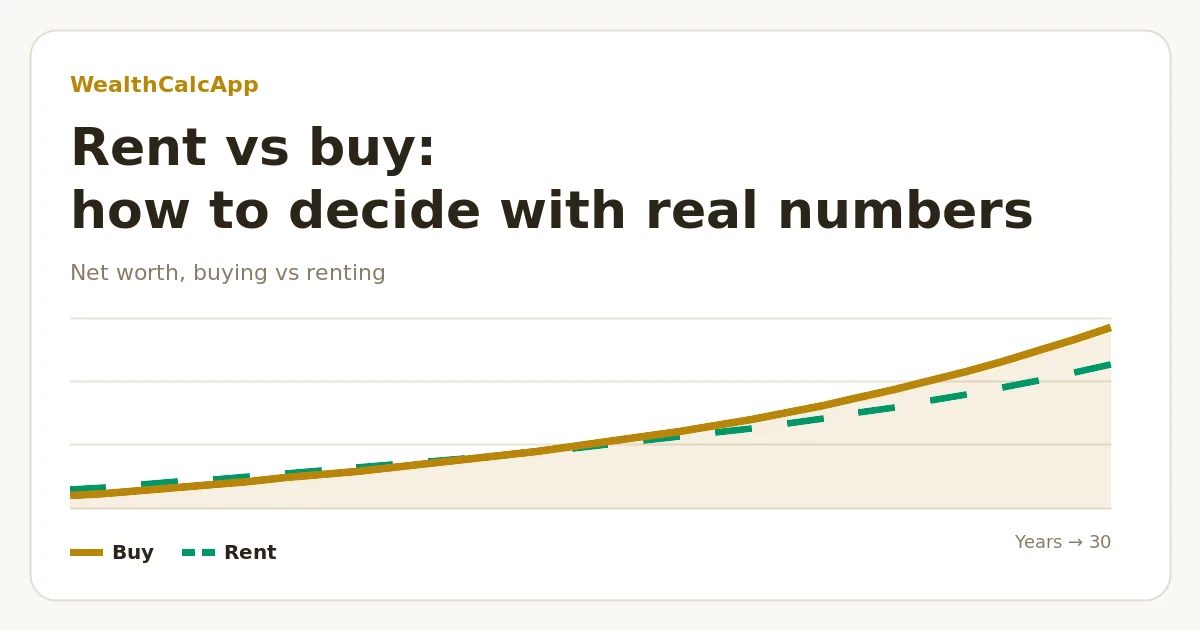
“Renting is throwing money away” is probably the most repeated sentence in personal finance — and one of the least examined. Rent buys you a place to live, flexibility and freedom from repairs. A mortgage buys you a house, but a large part of every payment is interest, and owning comes with costs that never come back. The honest question isn’t rent or own; it’s which path leaves you wealthier after the years you’ll actually stay, if both cost you the same each month. This guide answers it with real numbers.
What buying really costs (it’s not just the mortgage)
When people compare rent with a mortgage payment, they usually compare rent with the wrong number. Part of a mortgage payment is principal — money you keep as equity — but the rest disappears. The unrecoverable costs of owning are what you should put next to rent:
- Mortgage interest — at 6.5%, about 85% of your first payments is interest.
- Property tax, insurance and maintenance — together often 2% of the home’s value a year in the US.
- Transaction costs — roughly 2–5% in closing costs to buy and, traditionally, 5–6% in agent fees to sell (more negotiable since the 2024 commission changes).
- Opportunity cost — the down payment could have been invested instead.
Renting has its own unrecoverable cost — the rent itself — but no transaction costs, no repairs and no capital locked up. A popular rule of thumb, the 5% rule popularised by portfolio manager Ben Felix, sums up owning as roughly 1% property tax + 1% maintenance + 3% cost of capital = 5% of the home’s value per year. Multiply the price by 5% and divide by 12: if rent for a similar home is below that, renting is probably cheaper; if it’s above, owning probably wins in the long run.
A fair comparison: same budget, invest the difference
To compare properly you have to hold the budget constant. Each month, whoever spends less — the owner or the renter — invests the difference. On day one the renter also invests the money the buyer spent on the down payment and closing costs. At the end you compare net worth: the owner’s home equity (after selling costs) plus any investments, against the renter’s portfolio. That is exactly how our rent vs buy calculator works.
A worked example: a $400,000 home
Assumptions: $400,000 home, 20% down ($80,000), 6.5% fixed for 30 years (principal and interest: $2,023/month), 3% closing costs, 6% selling costs, taxes + insurance + maintenance at 2% of the value a year, homes appreciating 3% a year. The alternative is renting a similar home for $2,000/month (rent rising 3% a year) and investing at 6% a year. Price-to-rent ratio: 16.7.
| Years | Net worth if you buy | Net worth if you rent |
|---|---|---|
| 3 | $102,330 | $135,464 |
| 5 | $136,332 | $166,285 |
| 10 | $234,029 | $250,187 |
| 15 | $353,606 | $344,487 |
| 20 | $512,132 | $461,001 |
| 30 | $1,043,254 | $825,582 |
Renting is ahead for the first decade — buying has to “earn back” about $92,000 of upfront money and transaction costs first. Around year 14 buying overtakes renting, and over 30 years the owner ends up roughly $218,000 richer. You can open this exact scenario in the calculator and change any assumption.
What moves the break-even point
The answer is extremely sensitive to a few inputs. Changing one assumption at a time in the example above:
| Change | Buying wins after… |
|---|---|
| Home prices grow 1% a year (instead of 3%) | about 30 years |
| Home prices grow 5% a year | 4 years |
| Mortgage rate 5.5% (instead of 6.5%) | 7 years |
| Rent of $1,600 (instead of $2,000) | never within 30 years |
| Rent of $2,400 | 6 years |
| Investments earn 4% (instead of 6%) | 8 years |
| Investments earn 8% | never within 30 years |
Two lessons follow. First, the price-to-rent ratio matters more than anything: where homes are expensive relative to rents, renting and investing is hard to beat. Second, your time horizon is decisive: transaction costs are paid up front and take years to recover, so if there’s a real chance you’ll move within five years, renting is usually the safer bet.
What the spreadsheet can’t see
- Discipline. The model assumes the renter actually invests the difference every month. Many people don’t — and a mortgage works as forced saving.
- Flexibility. Renting makes it cheap to move for a better job or a different life. Owning ties you to one local market.
- Concentration. A home is a single, leveraged, illiquid asset. A portfolio of index funds is diversified and can be sold in a day.
- Stability and control. Owners can renovate, stay as long as they like and lock in their housing cost with a fixed rate.
- Taxes. Our comparison ignores taxes. In the US, up to $250,000 ($500,000 for married couples) of gain on a primary residence is tax-free if you lived there two of the last five years, while investment gains in a taxable account are taxed.
How to decide in five minutes
Start with the 5% rule to get a feel for your market. Then run your real numbers in the rent vs buy calculator, check what you can safely borrow with the affordability calculator, and see the full payment — taxes and insurance included — in the mortgage calculator. If buying only wins after more years than you expect to stay, rent, invest the difference and revisit the question when your life is more settled.
Frequently asked questions
Run your own rent vs buy numbers
Enter your home price, rent and assumptions to see your break-even year and net worth after any horizon.
Open the Rent vs Buy Calculator →
Passionate about finance and investing, with more than 6 years of hands-on experience in the crypto world. He shares analysis and financial education on his YouTube channel, Cripto Adicto.
Watch on YouTube →